Business Intelligence Consulting: Data-Driven Success


The roadmap for data-driven transformation
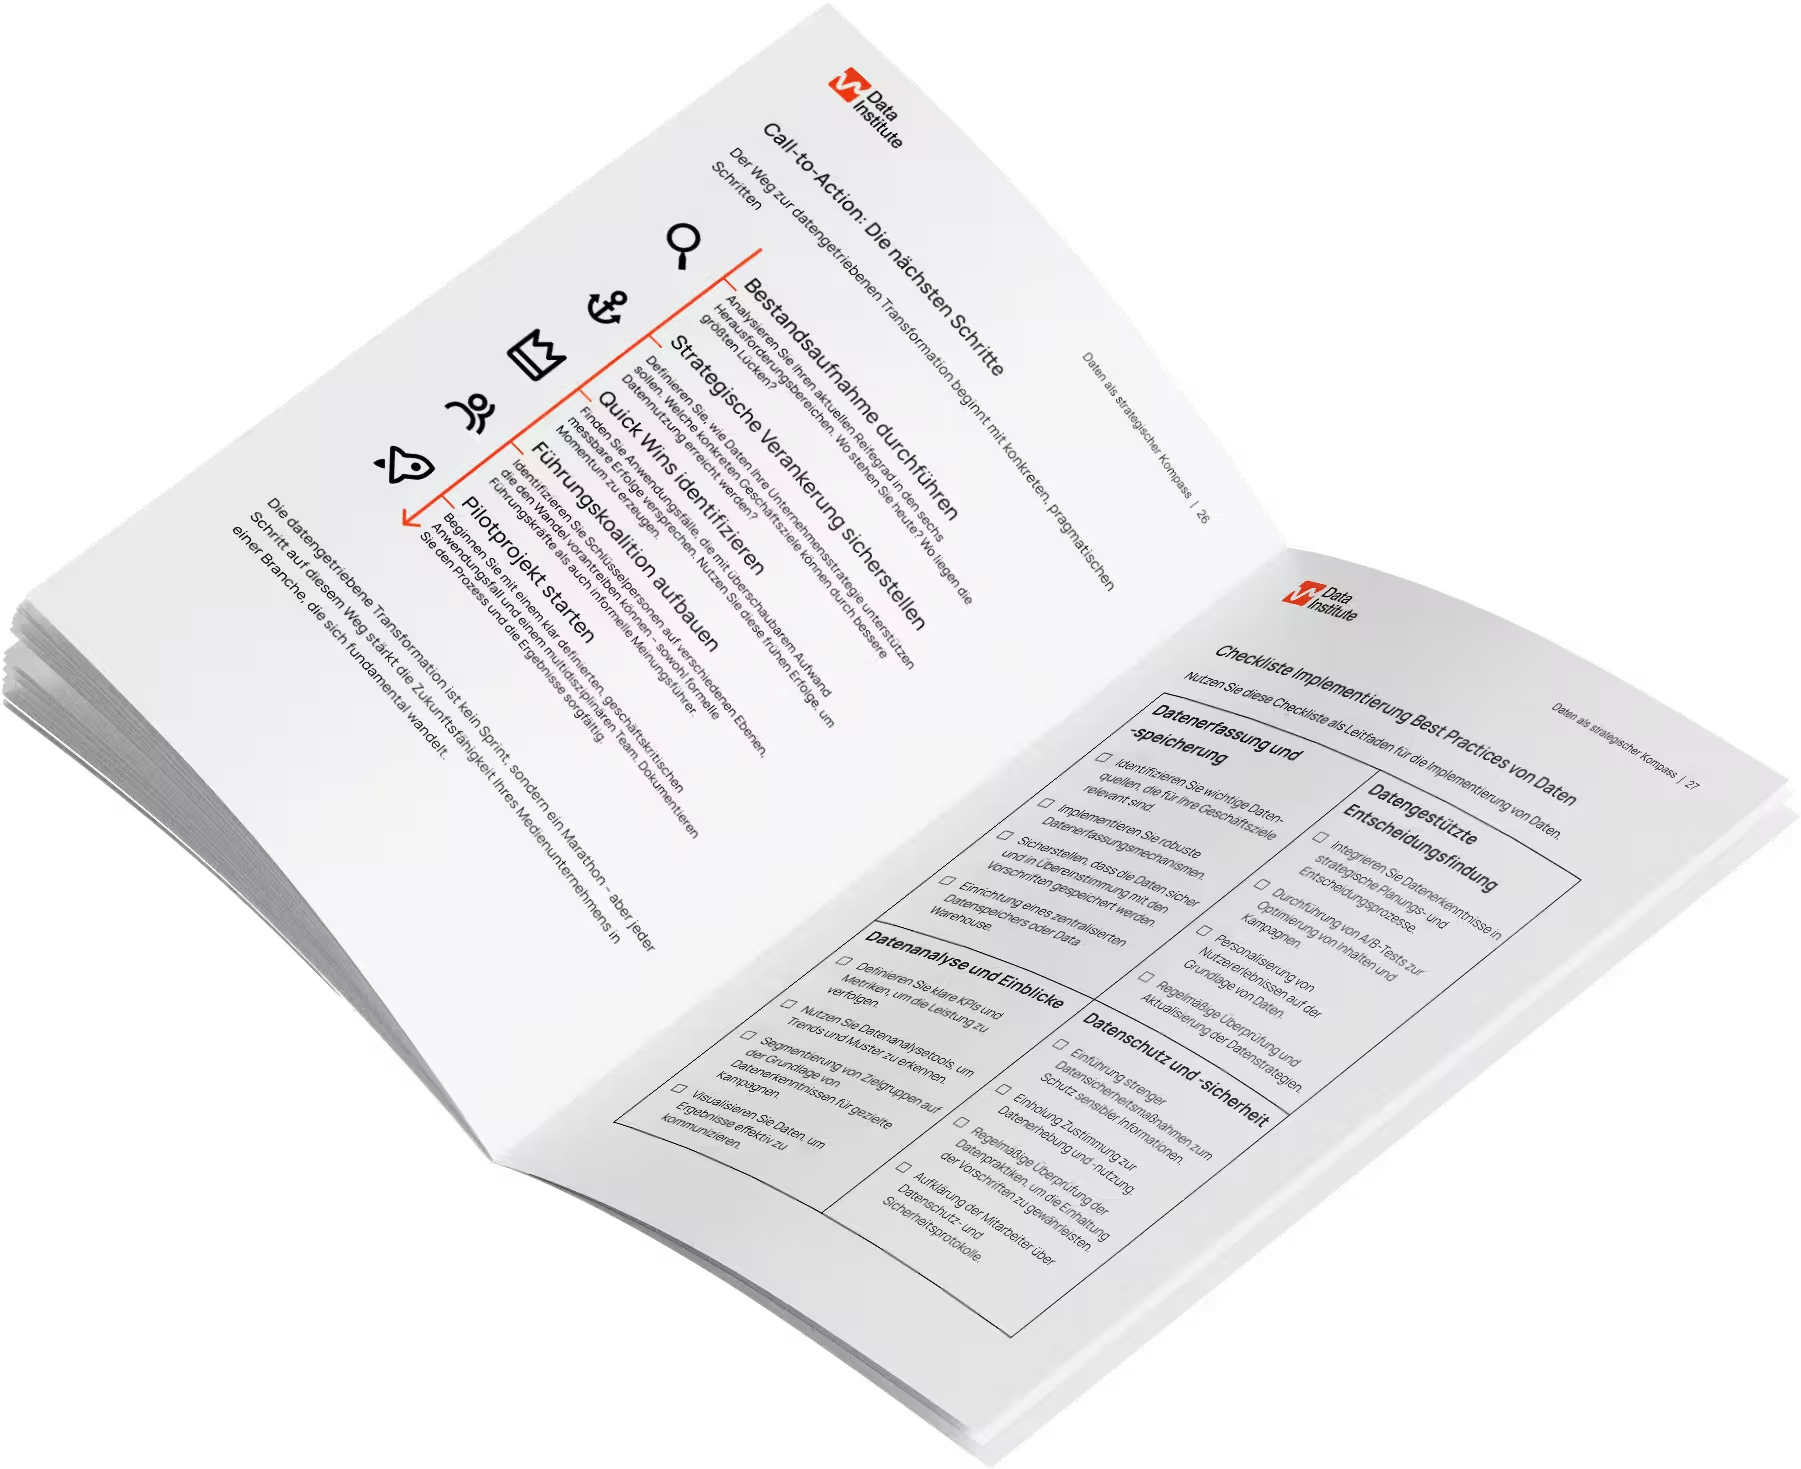
The ePaper shows you strategies, success stories and a checklist for a direct start into the digital future.
Why business intelligence consulting is your most important investment
Business intelligence consulting turns your data collection into a strategic compass for profitable decisions. Unlike traditional IT consulting, we focus not only on technology, but on measurable business success through data.
Our clients' concrete successes — your “quick wins”
MediaPrint (Austria's largest newspaper publisher):
- 34% increase in digital advertising revenue through advanced audience analyses
- 87% less manual effort for reports (from 4 hours to 30 minutes per day)
- 95% time savings in customer analytics (from 2 days to 2 hours per week)
- 99.9% system availability after modern data stack implementation
MediaPrint organizational development:
- 94% Data Champion adoption rate through Hub & Spoke model
- Faster data initiatives through clear roles and responsibilities
- Successfully overcoming silo structures in a complex stakeholder landscape
E-commerce retailer: 27% better customer loyalty through predictive churn modeling
Baby market: Complete analysis of customer behavior and product performance through modern data stack, central data access from various sources
Arrange a free BI strategy consultation →
What distinguishes business intelligence consulting from IT consulting
BI consulting is Your strategic business compass, not just another IT project. We transform data in three critical areas:
1. Immediate business impact
- Faster decisions: 5x faster decision cycles than competitors
- Minimize risks: Identify issues before they impact your business
- Maximize ROI: Optimally invest every euro in data analysis
2. Operational excellence
- Shortage elimination: Uncover and eliminate hidden inefficiencies
- Resource optimization: Focus budget and personnel on the most profitable activities
- Automation potential: Identify and digitize manual processes
3. Market intelligence
- Customer understanding: Segmentation for targeted targeting
- Separation detection: Identify market changes before competitors
- Sales opportunities: Identify undiscovered market segments and needs
The Data Institute Approach: Culture, Organization, Architecture
Why do 70% of all BI projects fail? They only focus on technology. Our proven framework addresses all three success factors:
Culture: Your employees as data champions
MediaPrint example: 94% data champion adoption rate through systematic change management
- Change management: Overcoming resistance to data-driven processes
- Empowerment workshops: Transformation of silo structures to cross-organizational collaboration
- Data culture transformation: From gut feeling to fact-based decisions
Organization: Clear structures for data success
MediaPrint example: Hub & spoke model for complex stakeholder landscape
- Roles & Responsibilities: Who decides what based on which data?
- Hub-and-spoke model: Centralized control with decentralized contacts
- Analytics Center of Excellence: Long-term expertise in your company
- Data Governance Board: Cross-organizational standards and best practices
Architecture: Robust technical basis
MediaPrint example: Modern data stack with compliance-first approach (99.9% availability)
- Modern data stack: Scalable, future-proof data infrastructure
- Tool-agnostic: The best solution for your goals, not our preferences
- Data quality: Guarantees a reliable basis for all decisions
- Compliance design: Antitrust and data protection requirements taken into account from the outset
Learn how we turn your data into competitive advantage →
Our proven 5-step process for BI success
1. Data audit: Your strategic starting point (2-6 weeks)
MediaPrint example: Comprehensive analysis identified challenges in culture, organization and architecture as a basis for successful 3-phase transformation
- Evaluate current data quality and sources
- Evaluate existing analytical capabilities
- Determine organizational data maturity
- Identify quick-win potential
2. BI strategy development: Your individual roadmap
MediaPrint example: Strategic roadmap for antitrust law compliant architecture with clear priorities
- Connect business goals with data capabilities
- Create a prioritized implementation roadmap
- ROI projection for every phase of implementation
- Technology recommendations based on your requirements
3. Data architecture: Your solid foundation
MediaPrint example: Modern Data Stack with BigQuery, Dataform, and Airflow — three separate data warehouses for compliance
- Data source integration and consolidation
- Data warehouse/lake architecture design
- ETL/ELT process implementation
- Data quality management systems
4. BI implementation: bring your tools to life
MediaPrint example: Three strategic use cases - editorial dashboard, customer golden record, advertising monetization
- Dashboard and report development for your decision makers
- Self-service analytics for operational teams
- Predictive models for strategic planning
- Mobile analytics on the go
5. Change management: your sustainable transformation
MediaPrint example: Hub & Spoke model established new meeting routines and cross-organizational collaboration
- Ensuring executive alignment and sponsorship
- User training and empowerment
- Establish continuous improvement processes
- Build data literacy across the organization
Why The Data Institute is your ideal BI partner
Business focus instead of being in love with technology
We don't measure success by implemented tools, but by yours business result. Every technical decision is justified by the business case.
Tool-agnostic advice for optimal solutions
While many providers only push Microsoft Power BI or other specific tools, we find the The best solution for your goals, your level of maturity and your team.
Cross-sector expertise
Our team brings experience from media, e-commerce, logistics and other industries — you benefit from Best practices across sectors.
Proven results
MediaPrint transformation (complete 3-phase journey):
- Phase 1 (Strategy): Clear roadmap and priorities for digital transformation
- Stage 2 (organization): 94% data champion adoption, successful hub & spoke implementation
- Phase 3 (technology): 87% less manual effort, 99.9% system availability
Schedule your free BI strategy consultation →
Common questions about business intelligence consulting
How quickly do we see first results?After just 2-6 weeks in a data audit, we identify quick wins. MediaPrint reduced manual reporting costs by 87% within the first project phase and achieved 99.9% system availability after full implementation.
Do we need to replace our existing systems?No Our tool-agnostic approach maximizes your existing investments. At MediaPrint, we integrated three separate data warehouse instances for compliance requirements without completely replacing existing systems.
How do you measure project success?Through clear KPIs that we define together: increased sales, cost reduction, efficiency gains and user acceptance. Each project is measured by the business results.
What involvement do you expect from our team?Successful BI transformation is a partnership. We adapt to your resources, but recommend active involvement of business and IT managers for optimal knowledge transfer.
Your next steps to transform BI
The most successful companies in 2025 will be data-driven — or they will be overtaken by data-driven competitors.
The Data Institute has already helped many organizations turn their data into competitive advantages.
Start your data-driven transformation today:
✅ Schedule a free BI strategy consultation
- 30 minutes non-binding analysis of your current situation
- Instant assessment your BI potential
- Specific quick wins for the first 90 days
- Tailored roadmap for your sector
Make an appointment now free of charge →
Related resources
Case studies: Modern data stack in e-commerce | MediaPrints complete data transformation - 3 phases | People at the heart of data strategy
Services: Reporting & Business Intelligence | data strategy | Data Audit | organizational development
glossary: Business intelligence basics | Data Catalog overview
What does your BI setup look like?
Let´s work on it together.
What does your BI setup look like?
Let´s work on it together.

What does your BI setup look like?
Let´s work on it together.
Related case studies
There are suitable case studies on this topic


Which services fit this topic?
Do you want the hottest news from the data world?
You can find it in our newsletter!
Do you want the hottest news from the data world?
You can find it in our newsletter!
Do you want the hottest news from the data world?
You can find it in our newsletter!