Power BI consulting


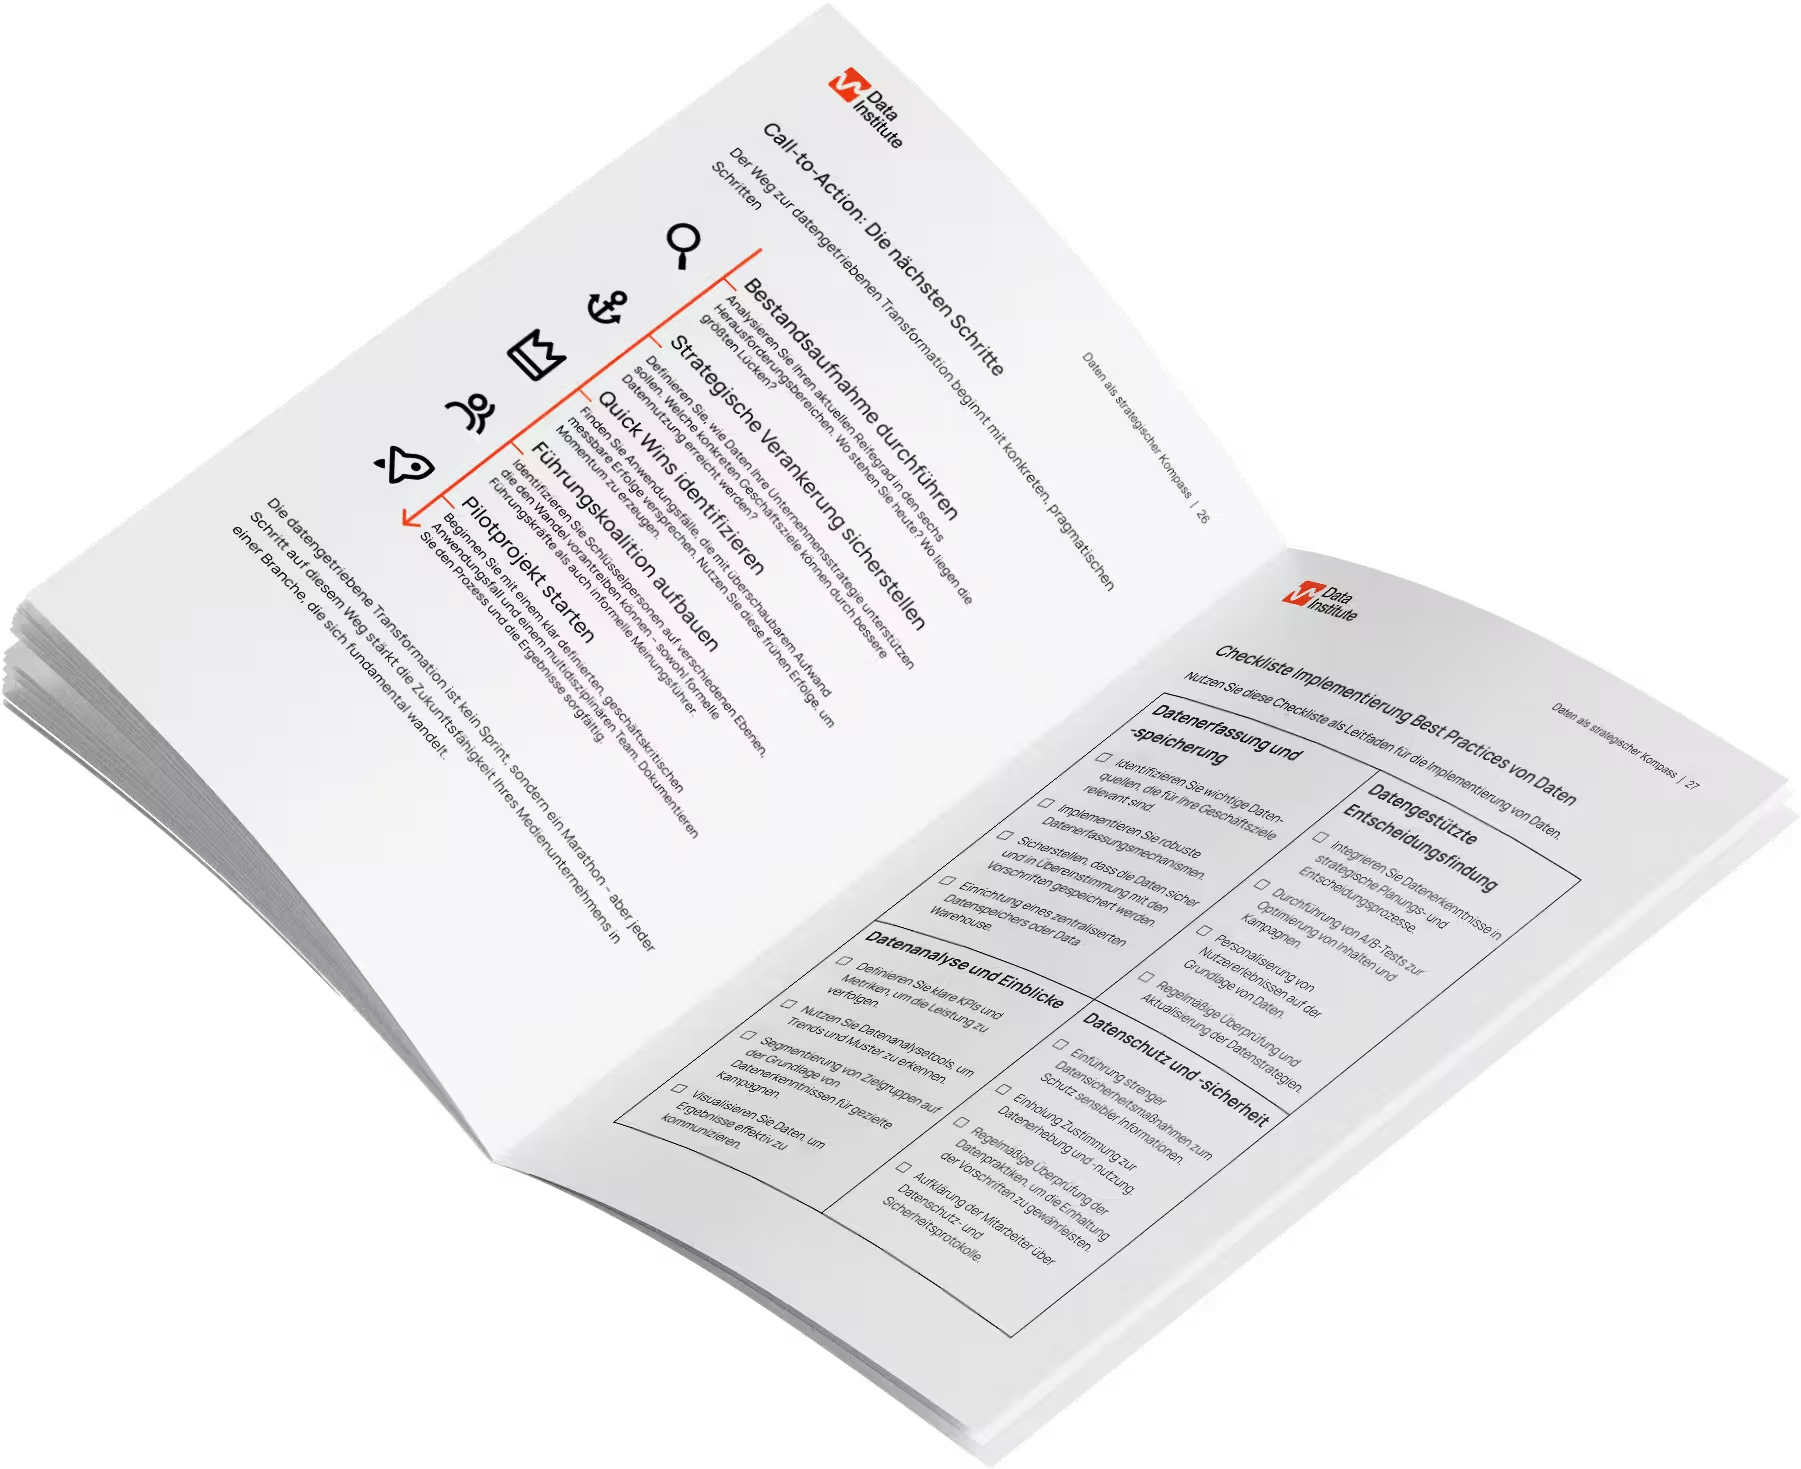
The roadmap for data-driven transformation
The ePaper shows you strategies, success stories and a checklist for a direct start into the digital future.
What is Microsoft Power BI?
Microsoft Power BI is a powerful tool for data analysis and visualization. It enables users to gain valuable insights from large amounts of data and present them in a simple and understandable way.
Microsoft describes the tool as an “end-to-end BI platform” so that there is only one significant data source.
Because Power BI can collect data from numerous sources, including local databases, Excel spreadsheets, cloud services, and even big data processes. It then enables employees to analyze this data, identify connections and create appealing interactive reports and dashboards — even powered by AI.
These visualizations enable decision makers to make well-founded, data-driven decisions—and that's exactly what a data-driven organization needs. Power BI can be used in desktop, mobile, and cloud versions, giving users flexibility and constant access to their data analytics wherever they are.
Power BI has become an integral part of many companies, also because it integrates into the existing Microsoft infrastructure.
Decide smarter with Power BI — the benefits of the tool
The benefits of Power BI as a data tool in companies are manifold.
Integration into the existing tool stack
Many companies are already “living” in the Microsoft world. Power BI fits easily into the tool stack and ensures few compromises and interface problems.
Intuitive usability
Power BI is very intuitive — this means short training and training for users and employees — and gives the advantage of “being able to get started right away.”
Self Service
With Power BI, you can create individual dashboards and reports and always see the latest key figures through real-time updates. This enables you to react quickly to important deviations in your company.
Cloud compatibility
Thanks to its cloud compatibility, Microsoft PowerBI enables employees to carry out powerful data analyses regardless of their location, whether in the field, home office or in the office. The PowerBI mobile apps also make work easier.
Centralize data
They can easily generate data sets from various data sources and integrate them with the Power BI data hub to create a uniform, reliable and easily accessible data source for all information.
Visualization made easy
Raw data can be converted into impressive visualizations using AI-powered, industry-leading analysis tools and an easy-to-use drag-and-drop report creation room.
What is the difference between Microsoft Power BI Desktop, Power BI Pro, Power BI Premium, and Power BI Mobile?
Microsoft Power BI is available in various variants.
Power BI Desktop is the “classic” version on the desktop, on which users can carry out in-depth analyses and calculations. Data is connected to the system, transformed and linked to data from other tools and interfaces.
Power BI Pro is the big sister — because it makes it possible to build a data-based culture. It is the basis for self-service, as it allows extensive data visualizations to be shared.
Power BI Premium goes even one step further and offers larger data capacities, advanced AI features, and the ability to publish reports locally using the Power BI Report Server.
Power BI Mobile is the perfect solution for those in the company who travel a lot, but also want to access dashboards on business trips or when commuting. This allows you to keep an eye on KPIs — and still be safe!
Why does a company need Power BI consulting?
Your company wants to be data-driven — and that requires the right tools in the area of business intelligence. MicrosoftPower BI offers you exactly the solution you need.
Implementation through professional Power BI consulting can provide valuable support here.
Consultants bring in-depth expertise and can develop individual solutions for the company's specific needs. They help seamlessly integrate Power BI into existing systems and processes, train employees how to use the tool and ensure that companies can utilize the full potential of their data. In addition, consultants can help avoid potential pitfalls and prevent common mistakes when implementing and using PowerBI. Power BI consulting is therefore a valuable investment to ensure an efficient and successful data strategy.
Product-independent advice — and why you need it
At The Data Institute, we are not only focused on Microsoft Power BI as a tool. On the contrary: We are open and find the solution that suits you, your goals, the level of maturity of the organization and the level of knowledge of the employees.
For this purpose, we are happy to start working with a Data Audit, in which we first define a company's status quo. This not only helps us with advice, but also helps you to get a better understanding of the organization.
On the basis of this audit, the data strategy are created for the company — which then decides which tools you want for Business intelligence and should establish data.
This is how we at The Data Institute approach our Power BI consulting
The Data Institute's approach is based on 3 pillars: organization, architecture and culture.
Power BI organization
The structure of a organization defines, among other things, the location of the data or BI department, the storage of data knowledge (in the context of knowledge management), the distribution of data strategists in various specialist departments and the communication processes relating to data. A distinction is often made between centralized and decentralized structures, although there are also hybrid models such as the data mesh or the hub-and-spoke model.
For the introduction of Power BI in a company, it is important to clearly formulate this form of organization — because this is the only way to decide who needs which access and roles of the tool, as well as who should receive which dashboards.
Power BI culture
The degree of innovation of a company is reflected in its culture where management and its open-mindedness towards new ideas and innovations are decisive. It is crucial to transfer this progressive thinking to the entire company in order to reach everyone involved. The most advanced reports and tools have no value if they are not used effectively.
At the beginning of the collaboration, we thus find out how mature the company is and which form of Power BI is suitable for the company. Here, it is important to us to save their resources and find the best solution for employees.
Power BI architecture
The data architecture acts as a blueprint for data, which indicates who collects which data and where and how this data is forwarded, stored and further processed. It provides an essential basis for obtaining a comprehensive overview of existing company data and for identifying potential data gaps.
Together, we will find out which data can be fed into the new tool, how it should be connected and for whom this data should be important and therefore available in Microsoft Power BI.
Power BI Questions & Answers
What is Power BI used for?
Power BI is used to collect, process, and analyze data from various sources to gain insights and make informed business decisions. It provides a visual presentation of data that enables users to identify and interpret trends, patterns, and anomalies. Organizations use Power BI for a wide range of applications, including:
1. Reporting and dashboards: With Power BI, users can create interactive dashboards and reports that present complex data in a simple and understandable way.
2. Data analysis and visualization: Power BI provides powerful analysis and visualization tools that enable users to search data, identify trends, and make predictions.
3. Self-service BI: Power BI allows non-technicians to analyze data and generate reports without relying on IT assistance.
4.Collaborate and share: With Power BI, users can easily share reports and dashboards with others in their organization, fostering a data-driven culture.
5. Data integration: Power BI can integrate data from a wide range of sources, including cloud-based services, spreadsheets, relational databases, and big data sources.
What makes Power BI Desktop different from mobile?
Power BI Desktop and Power BI Mobile are two different aspects of the Power BI ecosystem that are designed for different usage scenarios and requirements.
Power BI Desktop is a Windows application that is used to create data models, reports, and dashboards on a desktop or laptop computer. It is particularly useful for data analysts and business intelligence professionals who want to build and analyze complex data models and design detailed and interactive reports and dashboards. Power BI Desktop allows you to connect to various data sources, transform and load that data into a model, and use drag-and-drop capabilities to create visual reports.
Power BI Mobile On the other hand, it is a mobile application that is available for iOS and Android devices. It allows users to access created reports and dashboards and view them on-the-go. It is designed to enable users to monitor current business data from anywhere, receive notifications when data changes, and explore interactive reports and dashboards on their mobile devices. However, it is not as feature-rich as the desktop version and doesn't allow users to create or edit reports or dashboards.
Overall, Power BI Desktop and Mobile complement each other, as they allow you to create and edit detailed reports and dashboards, while allowing you to monitor this information anytime, anywhere.
What can Power BI do that Excel can't?
Although Excel and Power BI are both powerful tools for data analysis, Power BI offers a number of benefits and features that go beyond the capabilities of Excel:
Data visualization
Power BI provides advanced data visualization capabilities that go far beyond standard Excel charts and graphics. With Power BI, you can create interactive dashboards and reports that enable you to effectively visualize complex data sets.
Data capacity and performance
Excel has limitations on the amount of data it can handle effectively. Power BI, on the other hand, can easily handle much larger data sets and makes it possible to perform powerful queries and analyses on these large amounts of data.
Data timeliness
Power BI enables real-time data updates and monitoring, which isn't possible with Excel. This feature is particularly useful for companies that rely on up-to-date information.
Data connection
While Excel can read files and some databases, Power BI can access a far wider range of data sources, including big data and online services.
Collaborate and share
Power BI provides advanced features for sharing reports and dashboards, both internally and externally. Power BI also allows multiple users to work on a project at the same time.
Artificial intelligence
Power BI integrates artificial intelligence (AI) and machine learning into its platform, which allows users to generate predictive analyses and automated insights from their data.
Although Excel remains a powerful tool for many business and data analytics needs, Power BI provides a more far-reaching and scalable solution for more complex or larger data sets and analyses.
Is Power BI complicated?
As with any other software tool, the complexity of Power BI depends heavily on the experience and technical background of the users. For beginners in data analysis, it can be quite challenging to find their way around Power BI at first, especially when it comes to advanced functions such as DAX (Data Analysis Expressions) or PowerQuery.
However, Power BI has an intuitive interface and drag-and-drop features that make creating dashboards and reports pretty easy.
Another important advantage of Power BI is that the tool bridges the gap between the technical complexity of data analysis and the needs of business users. As a result, it offers features that are accessible to both data analysts and end users who are looking for clear and useful insights.
When do I need Power BI Premium?
Power BI Premium is needed when your business requires advanced features and larger capacity that go beyond what Power BI Pro offers. This could be the following situations, for example:
Larger volumes of data: If your organization needs to analyze very large amounts of data, Power BI Premium can be useful because it offers higher capacity limits and faster data update rates.
Extensive use: If a large number of users in your organization need access to BI reports and dashboards, Power BI Premium can be more cost-effective because it allows an unlimited number of read users, as opposed to Power BI Pro, which is based on one license per user.
Advanced Features: Power BI Premium offers advanced features such as paginated reports, AI capabilities, higher data update frequencies, and higher capacities.
Safety requirements: Power BI Premium provides additional security and management features, such as multi-geolocation, to meet compliance requirements when you need to store business data in specific geographic locations.
Basically, Power BI Premium is the right choice if the company needs a highly scalable BI solution with advanced features and greater flexibility.
Using the right tool in your company?
Not that easy at all. We'll help you make the right choice.
Using the right tool in your company?
Not that easy at all. We'll help you make the right choice.

Using the right tool in your company?
Not that easy at all. We'll help you make the right choice.
Related case studies
There are suitable case studies on this topic


Which services fit this topic?
More information from the world of data tools?
You can find it on our LinkedIn profile.
More information from the world of data tools?
You can find it on our LinkedIn profile.
More information from the world of data tools?
You can find it on our LinkedIn profile.