Asked too often #2: Why dbt, when we have DAX?


The roadmap for data-driven transformation
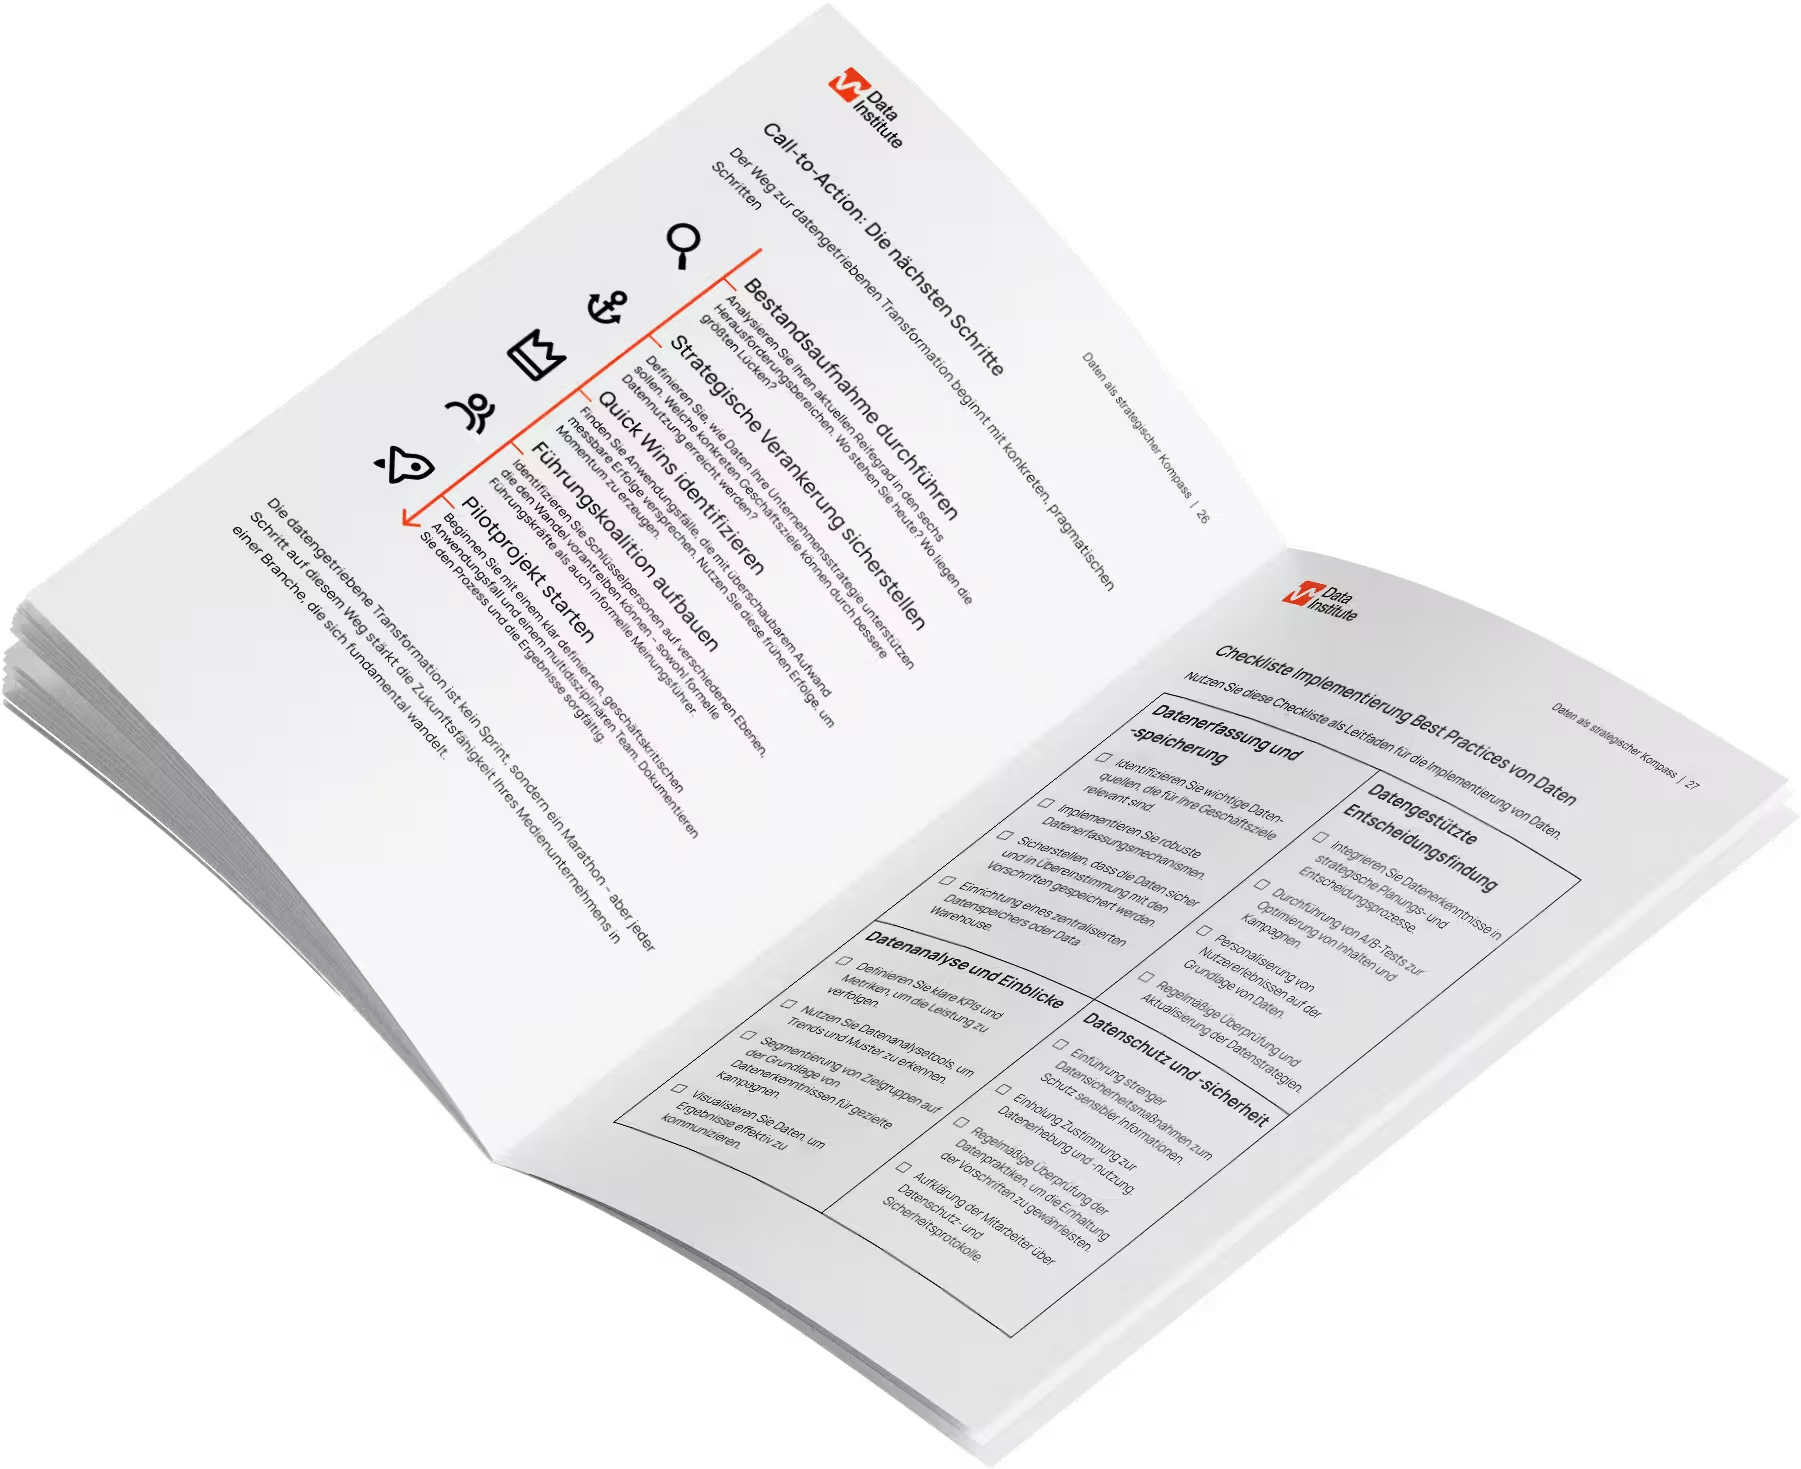
The ePaper shows you strategies, success stories and a checklist for a direct start into the digital future.
Why do we need dbt, when we have DAX?
As consultants, we work with many clients day in and day out. Many clients mean many questions that we have to answer, and because this can get tiring quickly, we've started collecting our answers in a blog series. In the last post, we kicked off by answering Why you shouldn't just query raw data. This time around, Bo Lemmers, Analytics Engineer at Xebia, and Mike Kamysz, Data Engineer at The Data Institute, will shed some light on the age-old battle of tools and philosophies: “Why do we need dbt if we have DAX?”.
On paper, this question seems innocent. Logical, even. After all, if your BI tool lets you do transformations with something like DAX (or LookML or whatever a tool calls its transformation capabilities), why would you need an entirely separate tool like dbt for data transformations? But let us stop you right there: this isn’t just a tool debate. It’s about strategy, scalability, and doing things right the first time.
Why people flock to DAX
Let’s start with the why. As an individual with a burning data question, you might find yourself lured into the songs of sales reps, promising you that this generation of BI tools will certainly be able to cover all your needs. Be it PowerBI with DAX, Looker with LookML, Tableau, or something else—at least it's not Excel, right?! So let's have a look at the factors that can make these tools oh so appealing.
1. Quick results
Transformations in a BI tool feel fast. Want to sum this column, calculate a ratio, create a time-series model? Slap together a DAX formula, and you'll have a chart ready in minutes. No ticket required. Certainly no lengthy review processes. Just plain, simple, and quick analysis.
2. One Stop Shop
Your company most likely licensed a BI tool. You're using it already to build dashboards, so why not handle data transformations in the same tool then? Everything stays self-contained and no complex pipelines are required to push data from A to B.
3. Low barrier to entry
Most BI tools come with user-friendly interfaces and built-in functionality to write formulas. For people who are intimidated by the likes of SQL, Git, or Command Line Interfaces, this removes many of the hurdles to get started with data and it's great for analysts who want quick insights.
4. The options are there
Tableau, PowerBI, and Looker offer direct connections to sync data from your operational tools (such as: Google Analytics, Salesforce, etc.). Therefore, suggesting they're built to enable you to handle all your data cleaning, transformation, and blending needs within their functionalities.
BI tools are the dream manifestation of a quick-and-dirty workflow. But, like most shortcuts, they have their limits. And when these limits hit, oh boy, do they hit hard.
The problem with doing everything in your BI tool
Let’s get straight to it: relying solely on DAX (or any BI-specific transformation language) to handle your data transformations is like building a house on a swamp (looking at you Dutchies). It might hold up at first, but as complexity increases, much like when Amsterdam dug beneath its historic center for a new metro line: you’re in for a world of pain. Here’s why:
1. Duplicated logic: Copy-Paste-Chaos
BI tools aren’t built to manage complex, shared logic across multiple reports or dashboards. Here’s what tends to happen: You create a DAX calculation for "Monthly Active Users", but later, someone else builds a different dashboard and recreates the same logic from scratch. This happens because DAX calculations aren’t automatically reusable across reports. While reuse is possible, it's not enforced, which leads to duplicate logic and inconsistencies. Then a third team might tweak the logic slightly (without informing you), causing metric drift, where everyone’s version of the same metric differs just enough to cause confusion and errors. Suddenly, your reports are contradicting each other, and trust in the data nosedives.
With a transformation layer, such as dbt, your logic is centralized within your data models, ensuring consistent and standardized definitions across the entire organization. This means everyone is working with the same definitions, reducing discrepancies and ensuring alignment in analysis.
2. Performance bottlenecks
It’s not as fast as you think. BI tools are optimized for visualizing data, not for transforming it. When you push heavy transformations, complex joins, or large-scale calculations into your BI tool, things can get ugly:
- Slow queries: Solely relying on your BI tool to pull raw data and perform transformations can be painfully slow, especially with large datasets. We've covered before in our previous post why querying raw data is a bad idea.
- Resource overload: Transforming data in the BI layer shifts the computational burden to your BI tool, which isn’t built for this. Your dashboards become slow, and your users get frustrated. Datasets can get too big to be loaded to the tools cache very quickly. By contrast, a transformation layer pushes data to your data warehouse, where compute power is abundant and optimized for transforming data. The result? BI tools can focus on what they do best: visualizing data.
3. Data Lineage: What's happening here?
Ever opened a BI dashboard and thought, “Where did this number come from?” Welcome to the land of no visibility. In BI tools, transformations are often tucked away in formulas, calculated fields, or layers of charts. This makes it nearly impossible to trace the origin of your metrics or debug issues. If something breaks, good luck figuring out where or why. With a transformation layer, like dbt, every transformation is written in SQL and version-controlled, making data lineage very clear. You can trace every column back to the raw source data, ensuring transparency and accountability.
4. Scalability: Good luck growing
BI tool transformations work fine when it’s just you or a small team building a couple of dashboards. But as your organization grows, so does the complexity: Multiple teams want to use the same metrics. Data volumes grow, and BI tool performance suffers. Governance is required to ensure a transparent and well-documented process for how data is transformed. Suddenly, what worked for one person in DAX doesn’t scale across an entire organization. dbt solves this by centralizing and automating transformations, ensuring consistency and scalability, no matter how big your data or team gets.
Why a transformation layer is the missing piece
Now that we’ve covered why transforming data directly in your BI tool is a slippery slope, let’s talk about why a transformation layer, for instance dbt, is the hero you need in addition to your BI tool:
1. Centralized logic for consistency
All your transformation logic lives in one place: the data warehouse. This ensures that everyone works with the same data: No more duplicate logic or metric drift. Every report pulls from the same, trusted source. Besides, dbt pushes all transformations into your data warehouse, leveraging its computational power. This means:
- Faster dashboards: BI tools work with pre-aggregated, optimized datasets, so dashboards load in seconds, not minutes.
- Cost efficiency: Warehouses like Snowflake and BigQuery are designed for heavy lifting, so transformations are faster and cheaper than doing them in your BI tool.
2. Quality testing at the right time
dbt allows you to add tests for missing values, duplicates, schema changes, and unexpected anomalies. By catching issues early, in the transformation stage, dbt ensures data integrity before it reaches your BI tool. If a key metric suddenly drops or a data source breaks, dbt flags the problem proactively, preventing incorrect insights before dashboard users even notice.
3. Version control and documentation
Every dbt model is version-controlled and documented, giving you:
- Traceability: Know exactly how every metric is calculated and where it comes from. dbt’s documentation and lineage features make it easy to meet compliance requirements and answer questions like, “How did we get this number?”
- Collaboration: Multiple people can contribute to the same transformations without stepping on each other’s toes.
How about DAX though?
Don’t get us wrong: DAX (and other BI tool transformation languages) has its place. It’s great for quick, last-mile calculations, things like custom ratios, formatting tweaks, or ad hoc metrics specific to a single report. Find here a clear overview of what should go in DAX and what goes in dbt:
The bottom line
So, why do you need dbt if you have DAX? Because relying solely on your BI tool for transformations is a recipe for chaos. dbt provides the foundation your data needs to be clean, consistent, and scalable. Even though DAX is the cherry on top for fine-tuning and customizing dashboards with dynamic calculations, a transformation layer in the data warehouse should always serve as a base for those calculations.
Your BI tool is amazing at visualizing data. dbt ensures that the data it visualizes is accurate, reliable, and ready to scale with your organization.
Is your company facing challenges surrounding best practices in data engineering, modelling or BI? We're here to help. Contact us and we'll reach out to you soon.
Photo by Stephen Dawson on Unsplash
Follow us on LinkedIn
Don't miss out on updates and insights
Follow us on LinkedIn
Don't miss out on updates and insights

Follow us on LinkedIn
Don't miss out on updates and insights
Related case studies
There are suitable case studies on this topic


Which services fit this topic?
Stay up to date
Subscribe to our newsletter
Stay up to date
Subscribe to our newsletter
Stay up to date
Subscribe to our newsletter