Data as a strategic compass


The roadmap for data-driven transformation
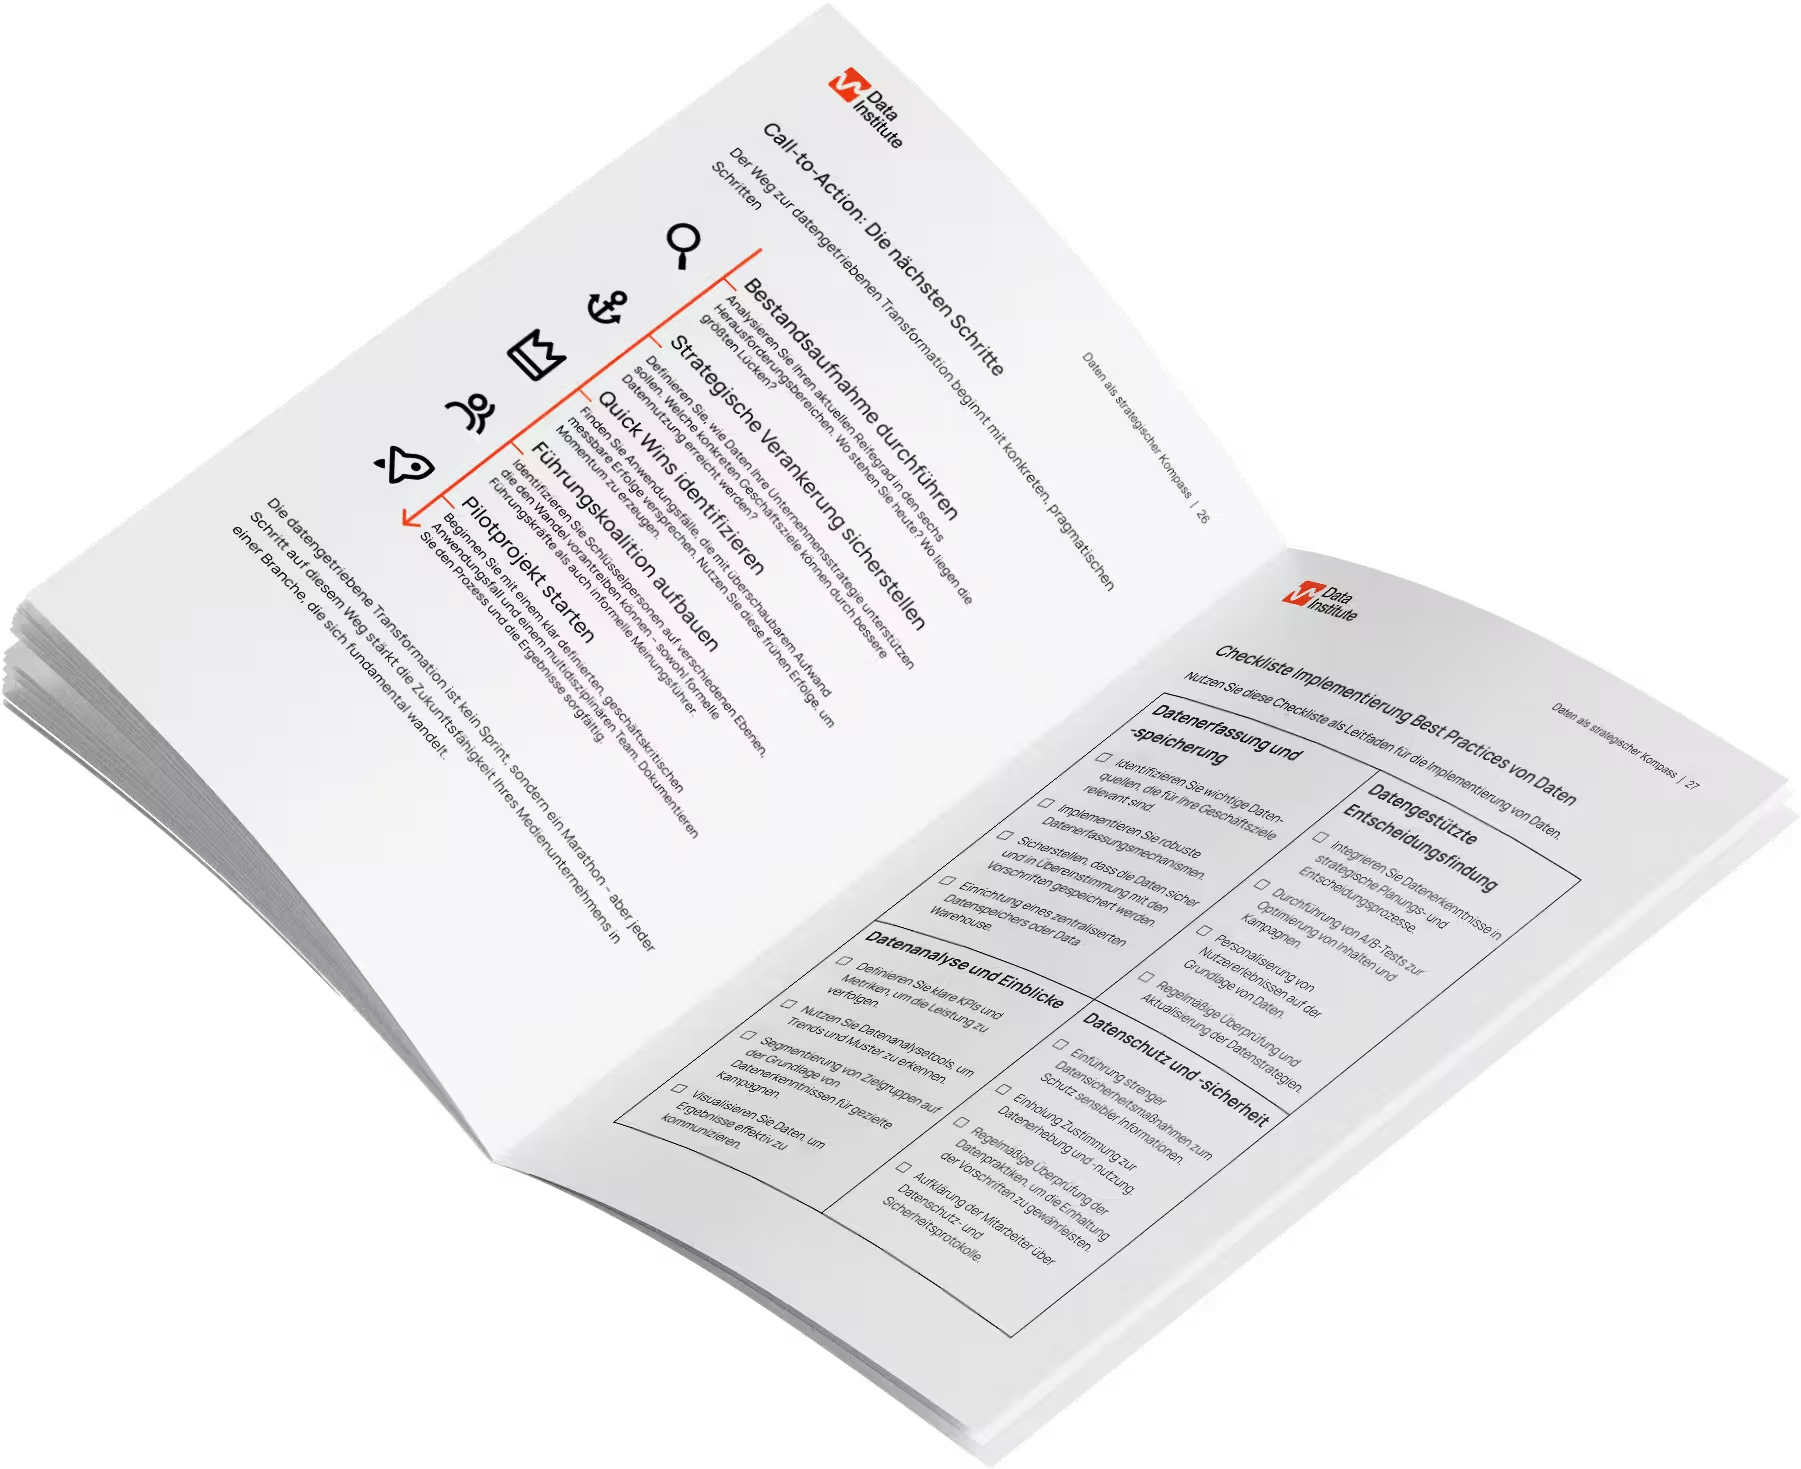
The ePaper shows you strategies, success stories and a checklist for a direct start into the digital future.
“Anyone who only collects data without using it strategically is like a sailor who has a compass but doesn't know how to read it.”
As I sat down with the head of digital at a media company last week, I heard a sentence that stuck in my mind: “To be honest, Michael, we have tons of data — but sometimes it feels like we're groping in the dark when it comes to the really important decisions.”
This moment reminded me of numerous similar conversations I've had with media professionals in the DACH region in recent years. They all face the same challenge: At a time when literally everything is measurable — from the first click to the subscription subscription — it is time to fish the truly valuable pearls from the sea of data.
The data challenges of everyday editorial work
In my years of consulting experience with many media companies, I have repeatedly experienced similar challenges:
For example, there is this the data flood dilemma. A medium-sized publisher had invested massively in tracking technology. “We're simply tracking everything now,” said the proud managing director. When I asked which three questions they wanted to answer as a matter of priority, there was a pause for thought. The technology was there — but the strategic embedding was still missing. But that's a good start.
Or do we take the symphony of key figures as I like to call them. With a business newspaper (which serves fantastic coffee, by the way!) The team presented me with an impressive dashboard. “Wow,” I thought, “there's a lot of work involved.” And in fact — the team had done incredible things! But: When I asked which of these many metrics had actually influenced strategic decisions, the answers became vague. Our joint learning: More data doesn't automatically mean better decisions.
Don't forget the departmental data worlds. Editorial, marketing and sales met at a workshop in southern Germany. Each department had brought their own data dashboards/reports. They were all impression—they just spoke completely different languages. What an aha moment when we put the data on top of each other for the first time! “We should have done that years ago,” said one participant. For example, the understanding of “Who is a subscriber” was different in the same company and was also incentivized differently.
A practical example: MediaPrint's successful transformation
Our MediaPrint case study shows how a systematic data strategy works in practice: Austria's largest newspaper publisher developed a clear data strategy through 20 interviews and workshops with 80 stakeholders from 10 areas – with measurable results such as an 80% increase in reporting efficiency and a 94% data champion adoption rate.
→ Read the full MediaPrint case study
The connection between data strategy and corporate strategy
In my consulting practice, I see time and again that many companies have difficulties effectively integrating their data analyses into strategic decision-making processes. This is one of the key challenges facing the industry, even though no specific quantitative surveys are available.
I remember a media project in southern Germany last summer. The managing director had an impressive vision for the digital future. The data analysts had brilliant evaluations. But somehow they didn't get together. The data analyses did not answer management's strategic questions, and management did not know what questions to ask data analysts.
Here are a few sources: https://reutersinstitute.politics.ox.ac.uk/digital-news-report/2023/dnr-executive-summary and https://leibniz-hbi.de/hbi-publications/reuters-institute-digital-news-report-2023/
This decoupling has very practical consequences:
- Budget frustration: A publisher from the Rhineland invested — well, let's say “significantly” — in a data infrastructure. A year later, there was great disillusionment. “Somehow we were hoping that the figures would speak for themselves,” the CFO confessed to me. It's no wonder the ROI didn't happen!
- Gut feeling remains king: In a meeting to develop a new digital offering, I observed how, despite extensive user data, the decision ultimately depended on the editor-in-chief's gut feeling. “The numbers are all well and good, but I just feel that our readers want something else.” There it was again, the old conflict between data and intuition.
- The smoke screen for success: During a digital project in Berlin-Mitte, I asked about the success of the data analyses. Shrug your shoulders. “We know that we measure a lot — but is it really effective?” This uncertainty is typical when there is no connection to the corporate strategy.
A lot to juggle: Diverse business models under one roof
A particular challenge that I see time and time again: Most media companies today are multi-talented with various sources of income:
- There is the classic print business, which still generates 60-70% of revenue at many regional houses (according to BDZV survey 2023)
- In addition, digital offerings — from freemium to consistent paywall
- E-commerce offerings and affiliate programs
- Content marketing and corporate publishing
Each area has its own KPIs, its own systems, its own data logics. It's no wonder that integration sometimes looks like a puzzle with 1000 pieces!
When Grimme Prize meets Excel: The editorial marketing divide
A phenomenon that makes me smile again and again: the different data worlds of editorial and commercial sectors.
At a workshop in Frankfurt, editor-in-chief and sales manager sat next to each other. The editor-in-chief raved about an investigative series that had required months of research — journalistically valuable, socially relevant. The sales manager listened politely and then showed her conversion data: Most subscriptions came through... Sports, gossip, recipes and gardening tips.
This scene has been repeated dozens of times in a similar way. And time and again I see how valuable it is when both worlds come together and think together: How can we ensure journalistic quality AND economic success?
What works: Practical approaches from our consulting practice
From our projects with publishers and media companies across the DACH region, three approaches have emerged that really work:
1. Development of a holistic data strategy
At a regional publisher, we hosted a two-day workshop last fall. Instead of complex data models, we started with a simple question: “What are your three most important strategic goals for the next 12 months?”
Based on these goals, we developed a data strategy backwards:
- What data do we really need?
- Which metrics show us whether we're on the right track?
- Who needs which data and when for which decisions?
The result was astonishing: The list of required data shrank while its relevance increased. “For the first time, I understand why we're collecting these figures,” said one editor.
2. The “Single Point of Truth” — More than just a technical project
A magazine publisher had a massive data problem: Each department worked with its own figures, which often contradicted each other. The solution? A data warehouse project — but with a special feature: We started with a “data dictionary.”
In sometimes heated discussions, we jointly defined terms such as:
- What exactly is an “active user”?
- From when is a visitor considered “recurring”?
- How do we define “engagement”?
This process was often laborious, but it paid off in the medium term: For the first time, all departments spoke the same language.
3. Data champions as bridge builders
At another media group, we introduced a concept that I particularly love: Data Champions.
In every department — from policy editors to sales — we identified a person who was interested in data (but didn't have to be an expert!). These champions received two to three days of basic training in data analysis and became the interface between their department and the central data team.
The highlight: The champions stayed in their specialist departments, understood their everyday life and needs, but at the same time were able to speak the language of the data experts. They became real translators and multipliers.
One year later, the change was noticeable: Instead of skepticism about data, there was curiosity. “We used to ignore the analyses, but today we are actively asking about them,” reported a department manager.
Do the check: How data-ready is your media company?
Take a minute and use this list to check where your company stands:
[__] Our data strategy is not a secret paper, but is known and understandable to all managers
[__] We know exactly which data we need for which important decisions
[__] When someone says “conversion rate,” they all mean the same thing (really!)
[__] We do not have parallel data worlds — we have a common database
[__] Editorial and commercial sectors regularly exchange findings
[__] We don't just make strategic decisions based on gut feeling
[__] Our infrastructure makes data analysis a pleasure, not a cramp
Be honest: How many points were you able to tick off? In my experience, most media companies score 3-4 points. The digital champions reach 7-9.
Conclusion: It's about people, not technology
After spending hundreds of hours in conference rooms at media companies, I am convinced that the success of digital transformation does not primarily depend on technology, but on the ability to use data as a common compass.
The media companies that are successful today have one thing in common: They have overcome data silos, developed a common language, and created a culture that promotes data-based decisions.
And best of all: This change is less a question of budget than of mindset. I've seen small local newspapers that have achieved amazing things with limited funding but a clear focus. And I've seen large media companies stuck in parallel data universes despite budgets worth millions.
Finally, my advice — from real life, not from the textbook: Start small, but start. Identify a specific problem that could be solved with better use of data. Form a small, cross-departmental team. And give him room to experiment.
The journey to a data-based organization is more like a marathon than a sprint. But every step counts — and the first is often the most important.
Related Articles in our series on data-driven strategies for media companies
- Data as a Strategic Compass: Learn how to effectively use data as a navigation aid for strategic decisions. With practical tips and success stories from the media industry.
- Garbage In, Garbage Out: Why data quality and integration are the crucial foundations of any digital strategy – and how to ensure them in your media company.
- Data Protection as a Competitive Advantage: How to balance data protection and personalization to develop a strategic advantage for your publishing house or media company.
- Bridges Instead of Walls: How Media Companies Overcome Data Silos: This article shows how publishers and media companies can overcome their data silos and increase their competitiveness.
- Becoming a Talent Magnet: Successfully Attracting Data Talent: Examines requirements, competitive disadvantages, and presents concrete solutions for how media companies can become attractive employers for data talent.
- Data vs. Gut Feeling: The Cultural Shift in Newsrooms How media companies can successfully manage the cultural transition to data-driven decision-making.
- The Path to a Data-Driven Media Organization: A Roadmap: Findings from the series of articles in which various facets and challenges were examined.
Would you like to learn more about this topic? Subscribe to our newsletter to receive more articles from our data competence series. Contact us at contact@datainstitute.io or schedule an appointment for individual consultation on overcoming data silos in your media company.
Media data strategy: a guide to success
Don't miss out on anything thanks to the newsletter.
Media data strategy: a guide to success
Don't miss out on anything thanks to the newsletter.

Media data strategy: a guide to success
Don't miss out on anything thanks to the newsletter.
Related case studies
There are suitable case studies on this topic


Which services fit this topic?
Stay up to date
Just subscribe to our newsletter.
Stay up to date
Just subscribe to our newsletter.
Stay up to date
Just subscribe to our newsletter.